Pacific Coast bike route: should you ride north to south?
See which way the wind blows along the Pacific Coast route, month by month and state by state, from ten years of hourly data.
The short answer
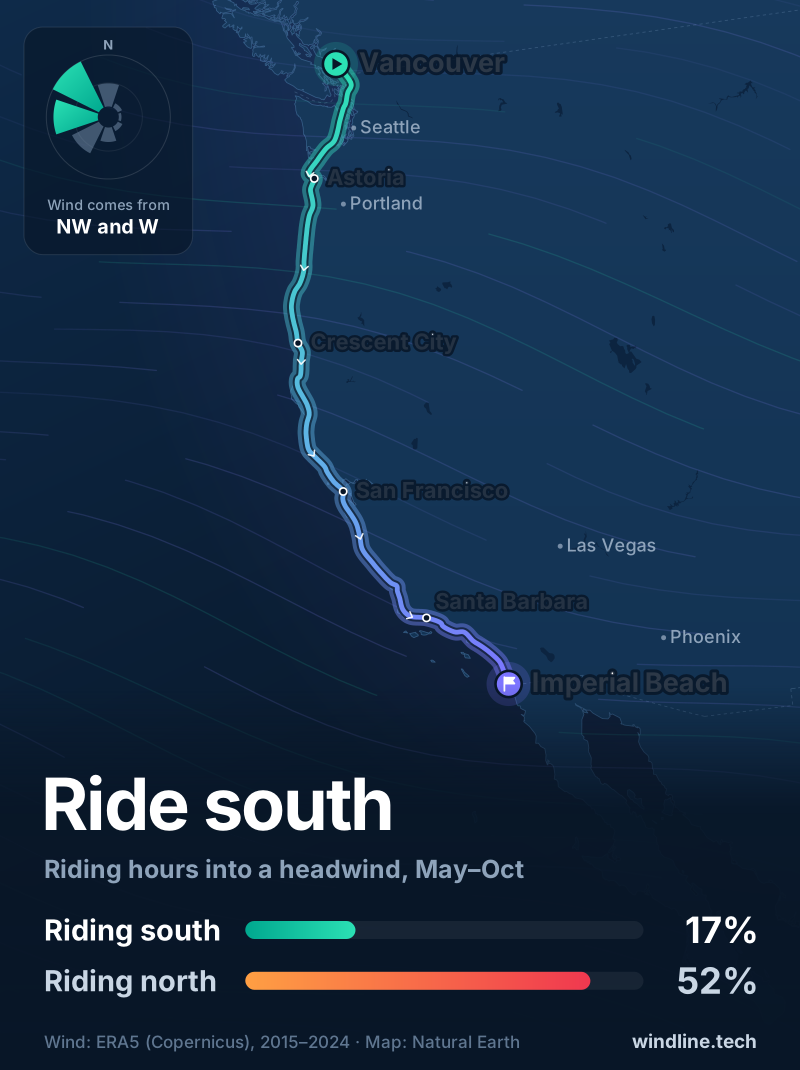
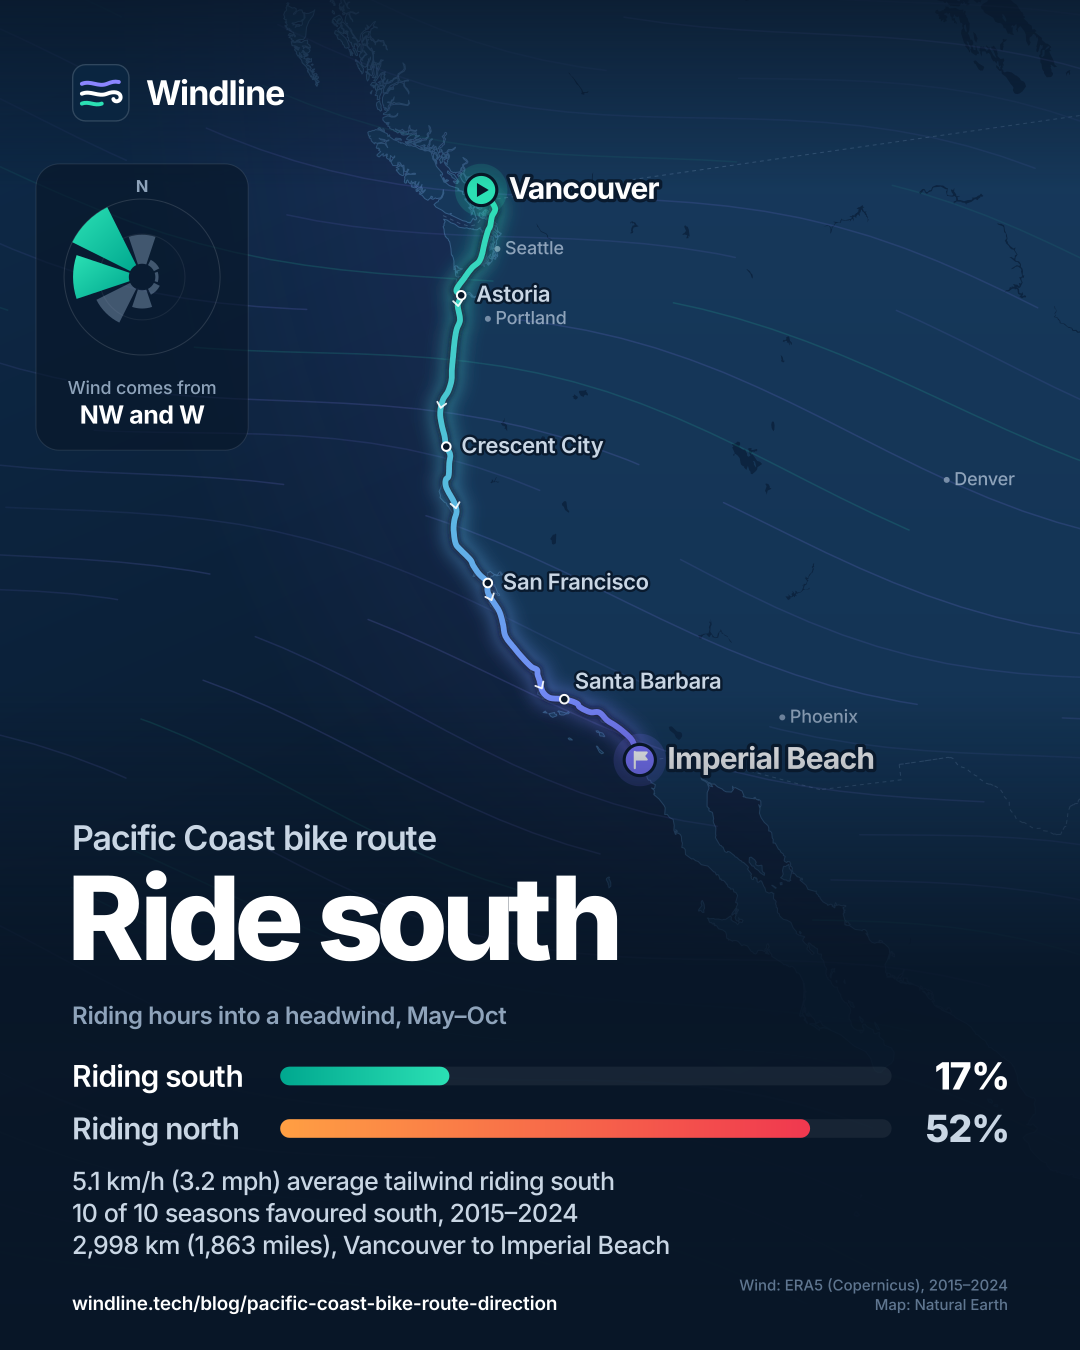
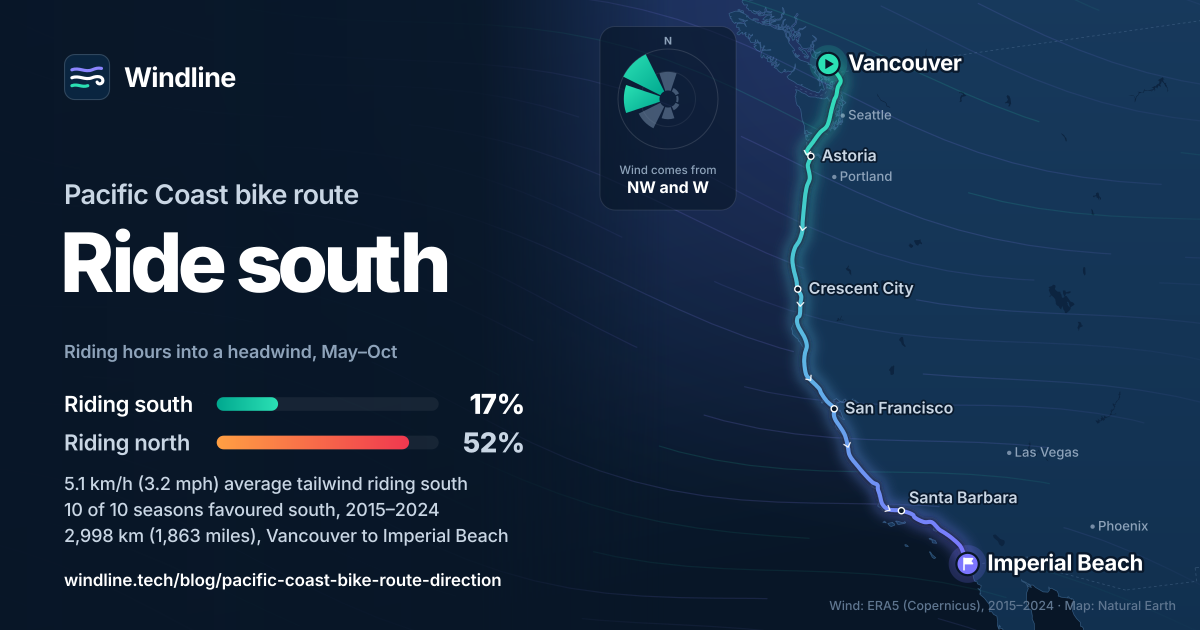
Ride the Pacific Coast bike route north to south. Over ten touring seasons (May to October, 2015–2024), southbound riders averaged a 5.1 km/h (3.2 mph) tailwind along the road, with headwind in 17% of daytime hours against 52% riding north. The gap is widest in July and briefly reverses in December and January.
Key takeaways
- Southbound averaged a 5.1 km/h (3.2 mph) tailwind from May to October, in all ten years studied.
- Northbound riders faced headwind in 52% of riding hours; southbound riders in 17%.
- Northern California and Oregon give the biggest push; Washington gives southbound riders a light headwind.
- Prevailing isn't guaranteed, so check a route-timed forecast for each day before you ride.
Definitions
- Along-road wind
- The part of the wind blowing along your direction of travel, counted as headwind when it's against you and tailwind when it's behind.
- Headwind hour
- A riding hour in which more than 4 km/h (2.5 mph) of the wind blows against your direction of travel.
- Reanalysis
- A reconstruction of past weather that combines historical observations with a weather model, giving consistent hourly values on a regular grid.
Which way is better on the Pacific Coast bike route, north or south?
South. Ten years of wind data favour riding the Pacific Coast bike route north to south, Vancouver to San Diego, from May to October. It's one of the routes in our guide to prevailing winds on the world's great cycling routes, alongside Britain's Land's End to John o' Groats. For everything else about the route, see our Pacific Coast bike route guide.
| The route at a glance | |
|---|---|
| Start and finish | Vancouver, BC, Canada, to Imperial Beach, California, USA |
| Length (Adventure Cycling route) | 1,862.6 miles (about 3,000 km) |
| Season we studied | May to October |
| Daytime wind comes from | North-west 26%, west 22%, south-west 15%, north 12%; calm 12% |
| Verdict | Southbound, in every year studied |
The Adventure Cycling Association (ACA) says "during summer, strong winds will prevail from north to south". Our data, hourly ERA5 wind in every grid cell along the route from 2015 to 2024, puts numbers on that.
How big is the tailwind advantage?
Riding south, you average a 5.1 km/h (3.2 mph) tailwind along the road from May to October. Northbound, it's a headwind.
| May to October, 08:00–17:00 | Southbound | Northbound |
|---|---|---|
| Average along-road wind, km/h (mph) | 5.1 (3.2) tailwind | 5.1 (3.2) headwind |
| Headwind hours, over 4 km/h (2.5 mph) | 16.6% | 52.0% |
| Tailwind hours, over 4 km/h (2.5 mph) | 52.0% | 16.6% |
| Strong headwind hours, over 15 km/h (9.3 mph) | 2.8% | 16.2% |
| Modelled riding time vs still air | −5.6% | +10.6% |
The other 31% of hours are side-on or light. That sounds small, but in our model a loaded touring rider who'd need 100 hours in still air needs about 94 hours riding south and 111 riding north. Over the ACA's 1,862.6 miles (about 3,000 km), that's roughly 20 more hours of pedalling northbound. Our headwind numbers explain why.
Want this for your own route? Windline shows the wind for every stretch, timed to your pace. Free. Make a free ride page →
How does the wind change month by month?
The southbound tailwind builds from April, peaks in July and fades through October. It's small or reversed from November to March; in December and January northbound wins.
| Month | Southbound along-road wind, km/h (mph) | Headwind hours, south / north |
|---|---|---|
| Jan | 2.7 (1.7) headwind | 38.2% / 28.8% |
| Feb | 1.3 (0.8) tailwind | 28.4% / 42.7% |
| Mar | 0.3 (0.2) tailwind | 33.0% / 39.4% |
| Apr | 3.7 (2.3) tailwind | 24.3% / 49.3% |
| May | 5.9 (3.7) tailwind | 16.9% / 54.8% |
| Jun | 6.1 (3.8) tailwind | 17.0% / 54.7% |
| Jul | 6.6 (4.1) tailwind | 12.0% / 56.0% |
| Aug | 5.6 (3.5) tailwind | 12.5% / 53.5% |
| Sep | 4.3 (2.7) tailwind | 17.8% / 49.9% |
| Oct | 1.9 (1.2) tailwind | 23.4% / 43.3% |
| Nov | 0.2 (0.2) headwind | 31.0% / 36.9% |
| Dec | 1.5 (0.9) headwind | 35.1% / 32.2% |
July is best for riding south, with the strongest tailwind and headwind in only 12.0% of riding hours.
Where on the route does the wind matter most?
On the Northern California and Oregon coasts, where the summer northerlies are strongest and the road runs with them.
| Section, May to October | Southbound along-road wind, km/h (mph) | Headwind hours, south / north | Riding time vs still air, south / north |
|---|---|---|---|
| British Columbia and Washington | 2.6 (1.6) headwind | 40.0% / 16.0% | +5.0% / −3.1% |
| Oregon | 7.1 (4.4) tailwind | 20.6% / 63.5% | −7.0% / +16.0% |
| Northern California | 8.0 (5.0) tailwind | 8.7% / 64.1% | −9.8% / +15.8% |
| Central and Southern California | 5.5 (3.4) tailwind | 8.5% / 53.9% | −7.0% / +10.4% |
- Northern California gives the biggest push: an 8.0 km/h (5.0 mph) average southbound tailwind.
- Oregon has the strongest winds. Between Gold Beach and Brookings, daytime wind averaged 26.9 km/h (16.7 mph), mostly from the north. In July the section averaged a 12.7 km/h (7.9 mph) southbound tailwind.
- British Columbia and Washington are the exception: a southbound headwind, but in light winds averaging about 9 km/h (6 mph).
- Southern California still gives a tailwind, but south of Santa Barbara the wind blows mostly onshore, from the west and south-west, hitting you more from the side.
The data grid smooths out headlands and gaps, where gusts are stronger. Our guide to riding in crosswinds covers technique.
Is southbound better every year?
Yes, in all ten seasons we studied. The weakest year, 2016, still gave southbound riders a 4.2 km/h (2.6 mph) average tailwind; the strongest, 2017, gave 5.7 km/h (3.5 mph).
The year-to-year spread was small, a standard deviation of 0.43 km/h (0.3 mph). We also simulated a 35-day trip from every May to October start date: 1,840 trips each way. Riding south beat riding north from the same date in 93% of them.
Single days still vary: even southbound, 16.6% of riding hours had a headwind.
What else favours riding north to south?
The ocean side of the road, and maps that run the same way.
- Ocean side. Traffic keeps right in Canada and the US, so southbound you ride beside the sea and reach viewpoints without crossing traffic.
- Maps. The ACA's five map sections run north to south.
- Traffic. The ACA warns of heavy recreational vehicle traffic on US 101 and Highway 1 in peak season, and names May and September to October as the best months.
- Fog. The ACA warns that dense fog can come in any season and drivers may not see you. Carry bright lights.
- Sea breezes. By day, land warms faster than the sea, so cooler sea air flows inland, as NOAA explains. That's why so much daytime wind blows off the water.
How should you plan your ride around the wind?
Pick southbound and a May to October start, then check each day's wind against the road.
- Expect a slow start. Washington's light winds lean slightly against you; the push starts in Oregon.
- Budget hours, not miles. Use our guides to how far you can cycle in a day and planning a multi-day tour. For other rides, see the best cycling routes in North America.
- Read a route-timed forecast. It shows the wind for each stretch at the hour you'll reach it, so you know if today is a rare southerly.
Frequently asked questions
Is it worth riding the Pacific Coast route northbound?
It can be, if your dates demand it, but expect much more headwind. From May to October, northbound riders faced headwind in 52.0% of daytime riding hours, against 16.6% southbound. In our rider model that's about 17% more time in the saddle. Only in December and January does northbound come out ahead.
What is the windiest part of the Pacific Coast bike route?
The southern Oregon coast, in our data. Between Gold Beach and Brookings, daytime wind from May to October averaged 26.9 km/h (16.7 mph), mostly from the north. Newport and Coos Bay averaged 15–16 km/h (9–10 mph), Crescent City 18 km/h (11 mph). Real headlands can be windier, because the data grid smooths them.
What is the best month to ride the Pacific Coast southbound?
For wind, July: southbound riders had headwind in only 12.0% of daytime hours and an average tailwind of 6.6 km/h (4.1 mph). For lighter traffic, the Adventure Cycling Association names May and September to October as the best months. May and September still gave a clear southbound tailwind; October a smaller one.
Does this wind data include gusts and storms?
No. We measured hourly average wind at 10 m (33 ft) above the ground, not gusts, during riding hours from 08:00 to 17:00. It shows what usually happens, not what a storm will do on a given day. Gusts and crosswinds are what make a ride unsafe, so check the forecast and any official warnings each day.
Where does this Pacific Coast wind data come from?
From ERA5, the European Centre for Medium-Range Weather Forecasts' reanalysis for the Copernicus Climate Change Service, downloaded from the Copernicus Climate Data Store. We took hourly wind for 2015 to 2024 in every 0.25° grid cell along the route, about every 25 km (16 miles), then worked out how much blew along the road in each direction.
Get the wind for your ride.
Upload a GPX, add your start time and pace, and see the headwind, gusts, rain and heat for every stretch of the route, timed to when you’ll be there. Free for riders.
Make a free ride page →Sources and method
- Copernicus Climate Change Service (ECMWF) (2026). ERA5 hourly time-series data on single levels from 1940 to present
- Quarterly Journal of the Royal Meteorological Society (2020). The ERA5 global reanalysis (Hersbach et al.)
- ECMWF (2026). ERA5: data documentation
- Adventure Cycling Association (2026). Pacific Coast route
- NOAA (National Oceanic and Atmospheric Administration) JetStream (2026). The Sea Breeze
Original analysis by Windline's data desk, October 2026. Wind data: ERA5 hourly reanalysis (ECMWF, Copernicus Climate Change Service), downloaded from the Copernicus Climate Data Store (dataset reanalysis-era5-single-levels-timeseries, doi:10.24381/1cf1ad76) for 1 January 2015 to 31 December 2024: hourly 10 m wind (u and v components, from which we took speed and direction), the average wind 10 m (33 ft) above the ground, not gusts. Route: a simplified line through 68 waypoints following the usual touring line, close to the Adventure Cycling Association's Pacific Coast route, from Vancouver, BC, to Imperial Beach, California; it is not the official route. The line was cut into pieces of at most 25 km (16 miles), and each piece takes its wind from the nearest ERA5 0.25° grid cell, so we used every 0.25° grid cell along the route, about every 25 km: 89 cells in all. A town's wind speed is that of the cell nearest it on the route; a section's average speed is the distance-weighted average of its cells. Riding hours: hourly values stamped 08:00 to 17:00 local time inclusive (10 a day, daylight saving applied). Season: May to October; monthly figures use each calendar month. Along-road wind = wind speed × cos(wind direction − direction of travel); positive is a headwind, and riding the other way flips the sign. A headwind hour has more than 4 km/h (2.5 mph) of along-road wind against you; a tailwind hour more than 4 km/h behind you; strong means more than 15 km/h (9.3 mph). Every figure is weighted by distance along the line and averaged over all riding hours in the period. The wind-direction shares are distance-weighted shares of riding hours by the compass sector the wind came from; calm means under 5 km/h (3.1 mph). Sections: British Columbia and Washington is Vancouver to Ilwaco; Oregon is Ilwaco to Brookings; Northern California is Brookings to San Francisco; Central and Southern California is San Francisco to Imperial Beach. Modelled riding time: a steady-power loaded touring rider (rider, bike and luggage 100 kg (220 lb), 120 W, drag area 0.45 m², rolling resistance 0.006, air density 1.2 kg/m³) who rides 24.1 km/h (15.0 mph) on the flat in still air, riding every stretch at every riding hour; wind at rider height taken as 0.65 × the 10 m wind; crosswind drag and terrain ignored. The 94 and 111 hours are 100 × (1 − 0.056) and 100 × (1 + 0.106); 1.106 ÷ 0.944 = 1.17, so about 17% longer northbound. The 20 hours: 1,862.6 miles = 2,998 km, which at 24.1 km/h is 124.4 hours in still air, 117.4 hours southbound and 137.6 hours northbound. Year-to-year: the May to October southbound average for each year from 2015 to 2024; standard deviation 0.43 km/h (0.3 mph). Trip simulation: a 35-day ride of the whole line, starting on every date in May to October from 2015 to 2024 (1,840 start dates; the trip must finish by 31 December 2024), each day covering an equal share of the distance and taking that day's 08:00 to 17:00 average along-road wind on every stretch; the two directions are compared from the same start date. Southbound had the lower trip-average headwind in 93.0% of start dates, and a net tailwind in 92.4% (northbound 9.2%). Limits: ERA5's grid cells are 0.25° apart (about 25 km) and ECMWF gives the model's native resolution as about 31 km (19 miles), so it smooths coastal effects such as wind accelerating round headlands and shelter in valleys and forests; 10 m wind is stronger than the wind at rider height. Conversions: 1 km/h = 0.621 mph, 1 mile = 1.609 km. Contains modified Copernicus Climate Change Service information (ERA5, 2015–2024); neither the European Commission nor ECMWF is responsible for any use of this information.
About the author
Wes Thomson, Founder, Windline. Wes Thomson builds Windline, live wind and weather forecasts timed to when riders reach each stretch of road. He built it for his own 2,093 km tour from Pont Drift to Cape Town, and writes these guides with the same focus: what the wind will do to your ride, and how to plan around it.