Cycling across America: east to west or west to east?
See what ten years of hourly wind data say about riding the TransAmerica Trail east or west, month by month and state by state.
The short answer
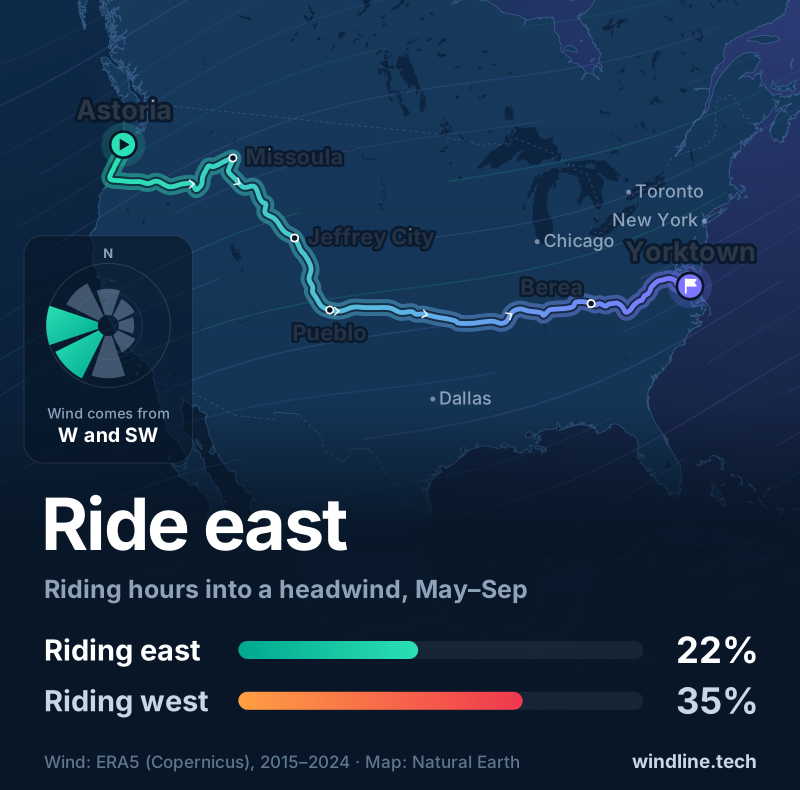
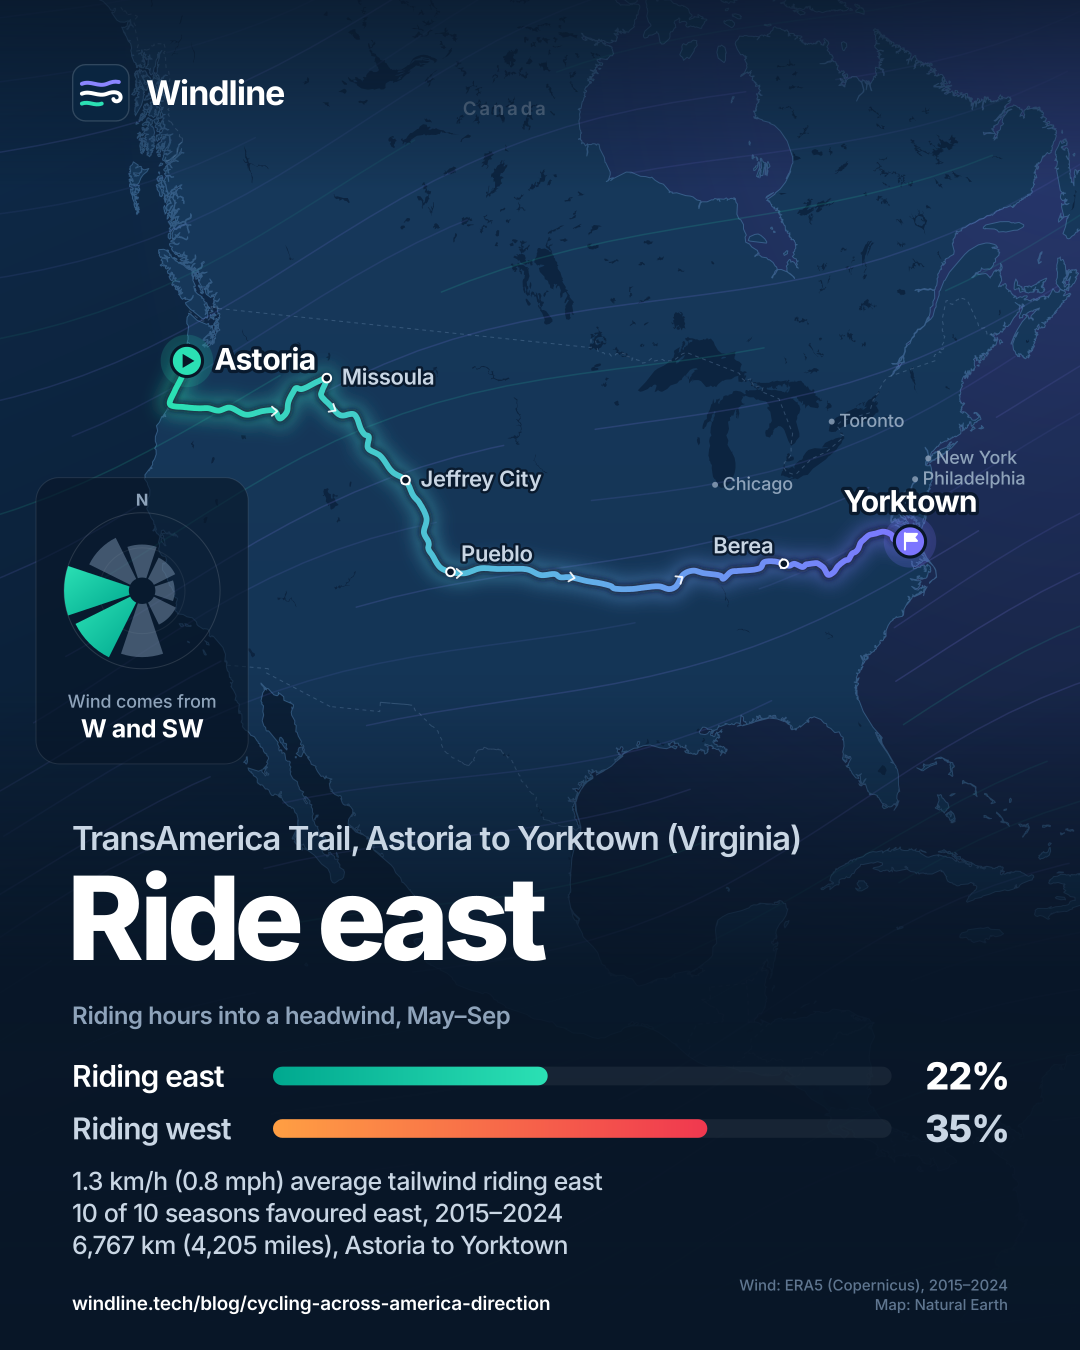
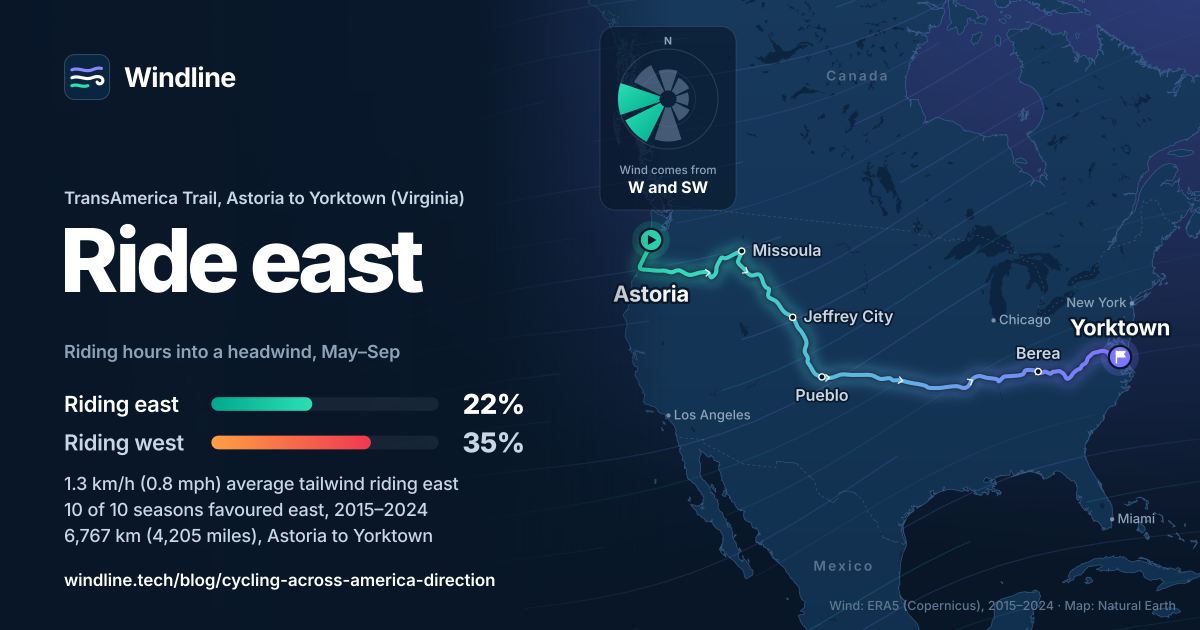
West to east has the better wind. Over ten years of May-to-September riding hours on the TransAmerica Trail, riders cycling across America eastbound averaged a 1.3 km/h (0.8 mph) tailwind and met headwinds 22% of the time, against 35% riding west. The edge is modest, held every year, and reverses in Kansas.
Key takeaways
- Eastbound had the better May-to-September wind in all ten years from 2015 to 2024.
- The average push is small, 1.3 km/h (0.8 mph); side-on wind averages 7.3 km/h (4.5 mph).
- Oregon and Wyoming help eastbound riders most; Kansas's southerly winds favour riding west.
- June and July favour riding east most; September is close to a draw.
- Snow on the passes, heat and your start date can matter more than the wind.
Definitions
- Along-route wind
- The part of the wind blowing straight along your direction of travel; against you it's a headwind, behind you a tailwind.
- Headwind hour
- A riding hour in which the wind along the route was more than 4 km/h (2.5 mph) against you.
- ERA5 reanalysis
- A record of past weather that blends observations from around the world with a weather model to fill in every hour and place.
Cycling across America east to west or west to east: which has the better wind?
West to east, by a small margin. We took ten years of hourly wind along the TransAmerica Trail, Astoria, Oregon, to Yorktown, Virginia, and scored every May-to-September riding hour in both directions. The method and other routes are in our hub on prevailing winds on the world's great cycling routes.
| Direction, May to September | Average wind along the route, km/h (mph) | Headwind hours | Tailwind hours | Modelled riding time vs still air |
|---|---|---|---|---|
| Eastbound (Astoria to Yorktown) | 1.3 (0.8) tailwind | 22.2% | 35.1% | 1.1% quicker |
| Westbound (Yorktown to Astoria) | 1.3 (0.8) headwind | 35.1% | 22.2% | 3.1% slower |
The other 43% of hours were side-on or calm. The westerlies rule holds: across the route, the wind came most often from the west (16.1% of riding hours), south-west (15.2%) and south (13.2%), and only 4.8% from the east.
It's a gentle push: side-on wind averaged 7.3 km/h (4.5 mph), more than five times the push along it. Westbound still loses more time, because a headwind costs more than a tailwind gives back.
Which months favour riding east?
All five, but September is close to a draw. June and July give eastbound riders the most help.
| Month | Eastbound wind along the route, km/h (mph) | Headwind hours, east / west | Modelled time, east / west |
|---|---|---|---|
| May | 1.2 (0.8) tailwind | 25.6% / 36.5% | −0.7% / +3.2% |
| June | 1.9 (1.2) tailwind | 20.5% / 38.7% | −1.9% / +4.0% |
| July | 1.8 (1.1) tailwind | 18.2% / 37.2% | −2.0% / +3.8% |
| August | 1.3 (0.8) tailwind | 20.7% / 33.1% | −1.2% / +2.8% |
| September | 0.5 (0.3) tailwind | 25.9% / 29.9% | +0.2% / +1.6% |
A crossing spans most of these, so the season figure is the fairer guide.
Want this for your own route? Windline shows the wind for every stretch, timed to your pace. Free. Make a free ride page →
Is the eastbound edge the same every year?
The direction is; the size varies a little. Eastbound riders had a net tailwind in all ten seasons from 2015 to 2024, from 1.1 km/h (0.7 mph) in 2023 to 1.6 km/h (1.0 mph) in 2017 and 2019.
We also rode the whole line in 75 days, both ways, from every start date between May and September. Eastbound had the better wind on 96.7% of 1,530 start dates. Westbound riders finished with a net tailwind on only 14.8% of them.
Where does the wind matter most on the TransAmerica Trail?
In Oregon and Wyoming, which favour riding east, and Kansas, which favours riding west.
| Section, May to September | Length, km (miles) | Eastbound wind, km/h (mph) | Headwind hours, east / west | Modelled time, east / west |
|---|---|---|---|---|
| Oregon | 824 (512) | 4.0 (2.5) tailwind | 10.4% / 49.5% | −5.1% / +7.5% |
| Idaho | 363 (226) | 1.9 (1.2) tailwind | 16.7% / 37.0% | −2.3% / +3.6% |
| Montana | 461 (286) | 1.7 (1.1) tailwind | 17.3% / 33.2% | −2.0% / +3.4% |
| Wyoming | 619 (385) | 2.5 (1.6) tailwind | 19.5% / 39.6% | −2.9% / +5.2% |
| Colorado | 599 (372) | 0.9 (0.5) headwind | 34.6% / 28.0% | +2.6% / −0.2% |
| Kansas | 740 (460) | 2.0 (1.2) headwind | 40.2% / 20.9% | +4.2% / −2.0% |
| Missouri | 368 (229) | 1.2 (0.7) tailwind | 22.6% / 33.4% | −1.1% / +2.6% |
| Illinois and Kentucky | 720 (447) | 1.8 (1.1) tailwind | 18.3% / 36.2% | −2.1% / +3.7% |
| Virginia | 642 (399) | 1.6 (1.0) tailwind | 18.1% / 35.3% | −1.7% / +3.3% |
Oregon is the biggest win for eastbound riders, and much of it comes before you turn east. The route first heads south down the coast, where summer wind blows from the north and north-west, the same pattern behind the Pacific Coast route's southbound habit.
Kansas is the surprise. In every Kansas grid cell, the most common riding-hour wind came from the south, 30–41% of hours. That's mostly side-on to a road heading east: Kansas had the biggest side-on wind of any section, 11.6 km/h (7.2 mph). But the route edges south-east, and south-easterlies are common too, so eastbound riders faced a net headwind in every month, May to September.
Our verdict: should you ride east or west?
If wind decides it, ride west to east. It held in every season month, every year, and on almost every 75-day start date we tested.
It's a tiebreaker, though: our model rider saves about nine hours of pedalling over the whole crossing. If your dates or travel point west, you'll lose little. For everything else about the route, see our TransAmerica Trail guide; for other big rides, our best cycling routes in North America.
What else should decide your direction?
Snow, heat and climbing often matter more than an average of 1.3 km/h (0.8 mph). The Adventure Cycling Association (ACA) notes:
- Snow. It "can occur at any time in the Rocky Mountains", and the highest pass, in Colorado, is over 3,505 m (11,500 ft). Snow usually keeps McKenzie Pass in Oregon closed until early July, though it may open to cyclists two to four weeks earlier. An early eastbound start meets it in the first days.
- Heat. Summer temperatures at lower elevations sometimes exceed 38°C (100°F), and more in Idaho's Snake River canyon. A May or June start puts the mid-route plains in high summer either way.
- Climbing. Eastbound, expect some climbing almost every day from Astoria to Pueblo. Westbound, you start with the Appalachians, which the ACA calls much harder to cross than the western mountains.
How should you plan around the wind for your dates?
Use the averages to pick a direction, then let the forecast take over.
- Pick the direction from the tables above; June and July help eastbound riders most.
- Build in spare days. Our guide to planning a multi-day cycling tour covers buffers and daily distances.
- Plan Kansas and Wyoming as exposed days. Shorten them if the forecast is strong, and see how windy is too windy to cycle. Official warnings always come first.
- Read each day's forecast against the road, a week out and the evening before: how to read a forecast for a bike ride.
Frequently asked questions
How much time does riding west to east save on the TransAmerica Trail?
About a day of pedalling. Our model touring rider does 24.1 km/h (15.0 mph) in still air, so our 5,337 km (3,316-mile) line takes about 221 hours. May-to-September wind made that about 219 hours eastbound and 228 hours westbound: a gap of roughly nine hours. The real road route is longer, so the gap grows slightly.
Is Wyoming as windy as cyclists say?
It's the windiest stretch we sampled. From Lander to Rawlins, every grid cell averaged 15.8 to 19.3 km/h (9.8 to 12.0 mph) in May-to-September riding hours. Adventure Cycling describes the Wyoming Basin's prevailing winds as generally south-easterly. Our riding-hour data there shows mostly south-westerly and westerly wind (52–66% of hours) and at most 2% from the south-east, which is why Wyoming favours eastbound riders.
How long does it take to cycle the TransAmerica Trail?
Adventure Cycling suggests planning around three months, give or take, for its 4,204.9-mile (6,767 km) route, and says it can be ridden from May through September. In our data, choosing a direction changes your pedalling time by hours, not weeks, so fitness, rest days and weather days matter far more.
Where is the calmest part of the TransAmerica Trail?
Idaho's river canyons. The grid cell at Riggins, on the Salmon River, averaged 5.8 km/h (3.6 mph) in May-to-September riding hours, and 39.4% of them were calm, under 5 km/h (3 mph). The windiest cells were around Rawlins, Wyoming, and near Tribune, Kansas, at 19.3 and 17.0 km/h (12.0 and 10.6 mph).
Why might the wind you feel differ from these averages?
ERA5 averages wind over grid cells about 31 km (19 miles) across, at 10 m (33 ft) above ground. In the Appalachian and Ozark valleys, trees and hills shelter you; on the plains, little does. Our time model assumes wind at rider height is 65% of the 10 m figure. Averages describe seasons, not your Tuesday.
Get the wind for your ride.
Upload a GPX, add your start time and pace, and see the headwind, gusts, rain and heat for every stretch of the route, timed to when you’ll be there. Free for riders.
Make a free ride page →Sources and method
- Adventure Cycling Association (2026). TransAmerica Trail
- Copernicus Climate Change Service (ECMWF) (2026). ERA5 hourly time-series data on single levels from 1940 to present
- Quarterly Journal of the Royal Meteorological Society (2020). The ERA5 global reanalysis (Hersbach et al.)
- Copernicus Climate Change Service (ECMWF) (2026). ERA5 hourly data on single levels from 1940 to present
- ECMWF (2026). ERA5: data documentation (native resolution 31 km)
Windline's data desk downloaded hourly 10 m wind from the Copernicus Climate Data Store, dataset reanalysis-era5-single-levels-timeseries (ERA5 hourly time series on single levels, doi:10.24381/1cf1ad76; ECMWF's ERA5 reanalysis for the Copernicus Climate Change Service), for 1 January 2015 to 31 December 2024 (ten full years). The route is a line through 98 towns and road points following the TransAmerica Trail's general course (Adventure Cycling Association) from Astoria, Oregon, to Yorktown, Virginia: the Oregon coast to Florence, McKenzie Pass, John Day, Baker City, Idaho's Salmon and Clearwater rivers, Lolo Pass, Missoula, Yellowstone and Grand Teton, Wyoming, Colorado (Walden, Hoosier Pass, Pueblo), Kansas, Missouri, southern Illinois, Kentucky and Virginia. It measures 5,337 km (3,316 miles) point to point; Adventure Cycling's road route is 4,204.9 miles (6,767 km). It is not an official route. The line was cut into pieces of at most 25 km, and each piece takes its wind from the nearest ERA5 0.25° grid cell: every 0.25° grid cell along the route, about every 25 km, 223 cells in all, so results are weighted by distance. ECMWF gives the model's native resolution as about 31 km, so these are area averages, not roadside readings. Riding hours are the values stamped 08:00 to 17:00 local time inclusive, in each cell's own time zone with daylight saving applied. The riding season is May to September (months 5 to 9), Adventure Cycling's stated season. For each hour and leg, the along-route wind is the wind speed times the cosine of the angle between where the wind comes from and the direction of travel; riding the other way flips the sign. A headwind hour has more than 4 km/h (2.5 mph) against you, a tailwind hour more than 4 km/h behind you; the rest are side-on or calm. Side-on wind is the average size of the crosswind part. Wind direction shares count where the wind comes from in eight sectors; hours under 5 km/h (3 mph) count as calm. Sections are split at Halfway (Oregon), Lolo Pass, West Yellowstone, Walden, Tribune, Ash Grove, Chester and Breaks. Year-to-year figures are the eastbound May-to-September average for each year (standard deviation 0.16 km/h). The trip test rides the whole line in 75 equal days in each direction, starting on every date from 1 May to 30 September in 2015 to 2024 (1,530 start dates), with each leg taking that day's average riding-hours wind; trips that start late in the season run on into October or later. Modelled riding time uses a steady-power touring rider: 100 kg (220 lb) of rider, bike and luggage, 120 W, rolling resistance 0.006, drag area 0.45 m², air density 1.2 kg/m³, which gives 24.1 km/h (15.0 mph) in still air; wind at rider height is taken as 0.65 times the 10 m wind, and crosswind drag is ignored. The hours in the FAQ are our arithmetic: 5,337 km / 24.1 km/h = 221.5 hours, times 0.989 (219.0 hours) and 1.031 (228.3 hours), a gap of 9.3 hours. The Wyoming figures cover the seven grid cells from Lander to Rawlins (south-west plus west 51.5% to 66.4% of hours, south-east 0.9% to 2.0%). The Kansas wind directions cover the 29 grid cells from the Colorado line (38.5°N, 102.0°W, the cell near Tribune) to the Missouri line. Every other figure is in results.json in the study's data folder. Imperial conversions use 1 mile = 1.609 km, 1 km/h = 0.621 mph and 1 m = 3.28 ft; °F to °C uses (F − 32) × 5/9. Contains modified Copernicus Climate Change Service information (ERA5, 2015–2024); neither the European Commission nor ECMWF is responsible for any use of this information.
About the author
Wes Thomson, Founder, Windline. Wes Thomson builds Windline, live wind and weather forecasts timed to when riders reach each stretch of road. He built it for his own 2,093 km tour from Pont Drift to Cape Town, and writes these guides with the same focus: what the wind will do to your ride, and how to plan around it.