Danube Cycle Path (EuroVelo 6): which direction is best?
See what ten years of hourly wind data say about riding the Danube downstream or upstream, month by month and country by country.
The short answer
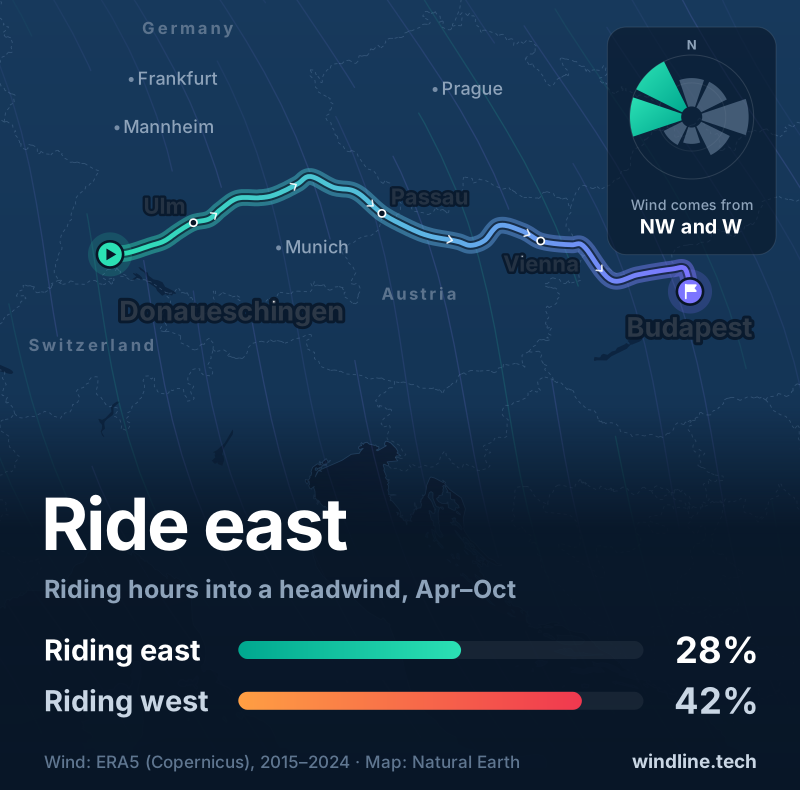
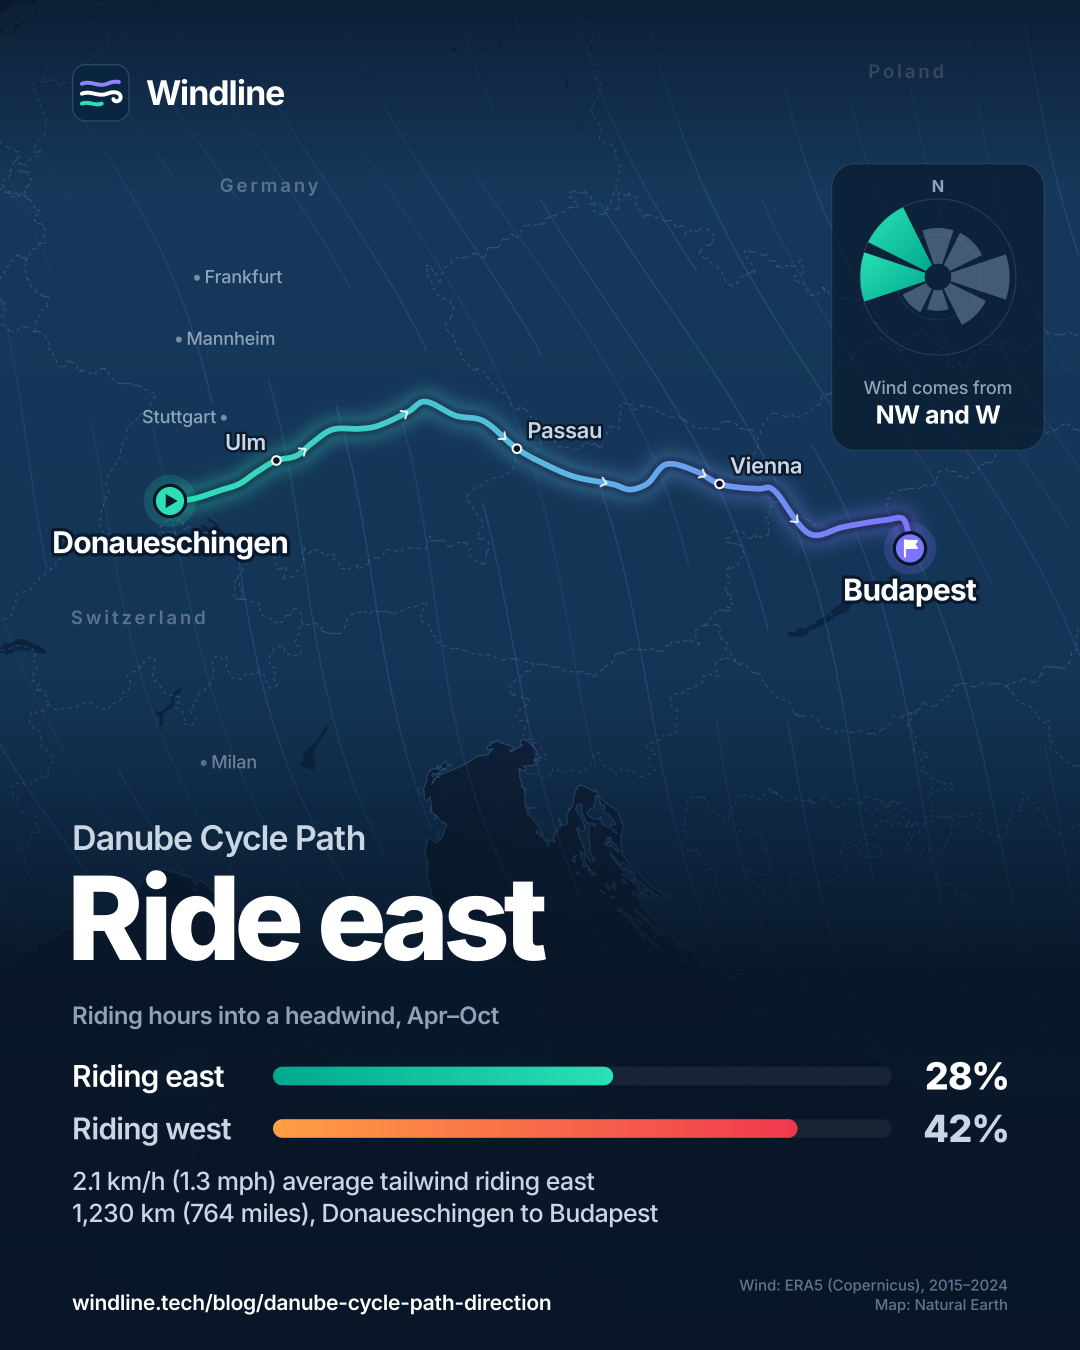
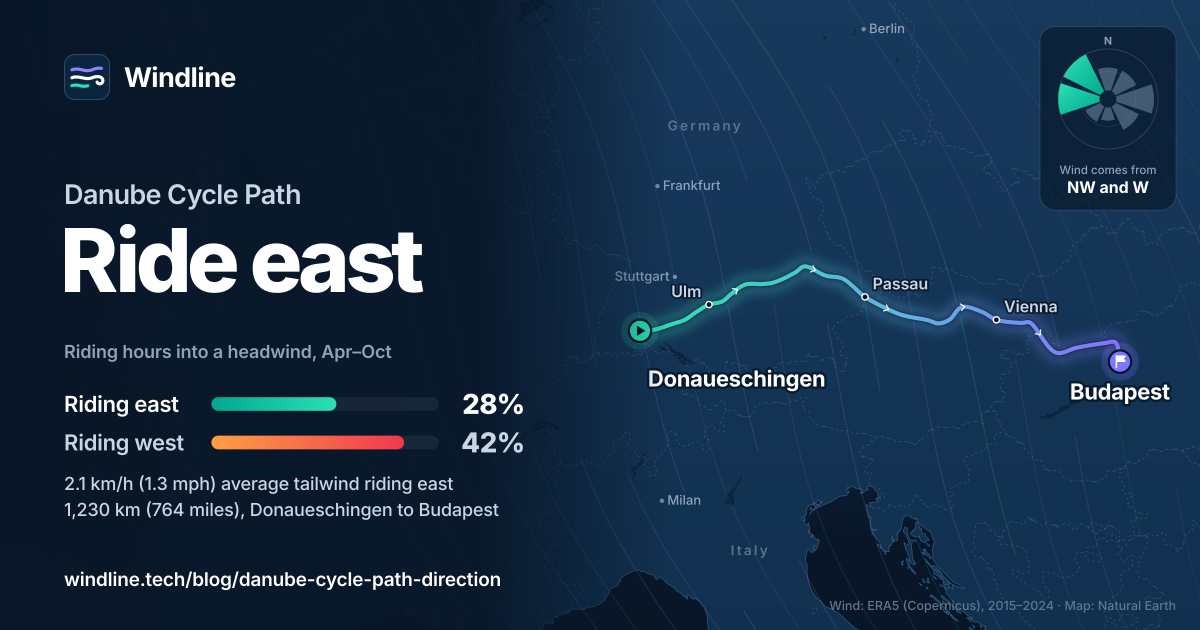
The best Danube Cycle Path direction is downstream, west to east. Over ten years of April-to-October riding hours, downstream riders from Donaueschingen to Budapest averaged a 2.1 km/h (1.3 mph) tailwind and met headwinds 28% of the time, against 42% riding upstream. Below Belgrade the edge disappears.
Key takeaways
- Downstream had the better April-to-October wind in eight of ten seasons from 2015 to 2024.
- Passau to Vienna gives the biggest push, a 2.6 km/h (1.6 mph) average tailwind.
- Riding upstream through Austria, the wind costs you over six times more than the climb.
- July favours riding downstream most; August is a draw.
Definitions
- Along-route wind
- The part of the wind blowing straight along your direction of travel; against you it's a headwind, behind you a tailwind.
- Headwind hour
- A riding hour in which the wind along the route was more than 4 km/h (2.5 mph) against you.
- ERA5 reanalysis
- A record of past weather that blends observations from around the world with a weather model to fill in every hour and place.
Which direction is best on the Danube Cycle Path?
Downstream, west to east. We scored ten years of April-to-October riding hours along the Danube, Donaueschingen to the Black Sea, in both directions. The method and other routes are in our hub on prevailing winds on the world's great cycling routes. For sections, ferries and trains, see our Danube Cycle Path guide.
| The route at a glance | |
|---|---|
| Start and finish | Donaueschingen, Germany, to Budapest for most riders; EuroVelo 6 carries on to Constanța on the Black Sea |
| Length | About 1,230 km (764 miles) to Budapest |
| Season we studied | April to October |
| Riding-hour wind comes from | North-west 15%, west 15%, east 14%; calm 18% |
| Verdict | Downstream, in 8 of 10 seasons |
| Direction, April to October | Wind along the route, km/h (mph) | Headwind hours | Tailwind hours | Modelled riding time vs still air |
|---|---|---|---|---|
| Downstream, Donaueschingen to Budapest | 2.1 (1.3) tailwind | 27.5% | 42.4% | 1.7% quicker |
| Upstream, Budapest to Donaueschingen | 2.1 (1.3) headwind | 42.4% | 27.5% | 5.0% slower |
| Downstream, the whole river to the Black Sea | 1.0 (0.6) tailwind | 31.4% | 37.6% | No change |
| Upstream, the whole river | 1.0 (0.6) headwind | 37.6% | 31.4% | 3.3% slower |
Either way the push is gentle: the average side-on wind, 5.6 km/h (3.5 mph), was bigger. It still counts, because a headwind costs more than a tailwind gives back.
Which months favour riding downstream?
Most of them. July gives downstream riders the most help; August is a draw.
| Month, whole river | Downstream wind along the route, km/h (mph) | Headwind hours, down / up | Modelled time, down / up |
|---|---|---|---|
| April | 1.9 (1.2) tailwind | 31.0% / 42.8% | −0.9% / +5.3% |
| May | 0.5 (0.3) tailwind | 35.1% / 37.0% | +1.1% / +2.6% |
| June | 1.2 (0.8) tailwind | 28.8% / 37.7% | −0.5% / +3.3% |
| July | 2.8 (1.7) tailwind | 22.4% / 44.6% | −3.0% / +5.9% |
| August | 0.0 (0.0), even | 33.7% / 32.2% | +1.3% / +1.3% |
| September | 0.4 (0.3) tailwind | 33.9% / 34.5% | +0.9% / +2.3% |
| October | 0.4 (0.2) tailwind | 34.6% / 34.6% | +1.1% / +2.4% |
In May, August, September and October both directions were slower than still air: mixed wind costs more than it repays. The downstream habit is strongest in winter: January averaged a 3.6 km/h (2.2 mph) tailwind.
Want this for your own route? Windline shows the wind for every stretch, timed to your pace. Free. Make a free ride page →
Is the downhill gradient or the wind the bigger help?
The wind. The river falls so gently you'd hardly notice it on a bike.
Upper Austria's north-bank route from Passau to Bratislava climbs 345 m (1,132 ft) and descends 496 m (1,627 ft) in 381 km (237 miles): a net drop of 151 m (495 ft), or 0.04%. In our rider model, that makes you about 0.9% quicker downstream and 0.9% slower upstream.
From Passau to Vienna, the wind makes our model rider 2.2% quicker downstream and 6.1% slower upstream. Riding upstream, the wind costs more than six times what the climb does.
Between Passau and Vienna, downstream riders had a net tailwind in every month; from April to October it ranged from 1.3 km/h (0.8 mph) in May to 5.4 km/h (3.4 mph) in July. In August, when the whole river's wind is a draw, only the gradient still favours downstream.
Is downstream better every year?
Usually. Downstream riders had a net tailwind in eight of the ten seasons from 2015 to 2024, strongest in 2017 at 2.8 km/h (1.7 mph). In 2018 the wind leant 0.2 km/h (0.1 mph) the other way, and 2019 was even.
We also rode the whole line in 30 days, both ways, from every April-to-October start date: 2,140 trips each way. Downstream had the better wind in 66.5% of them, about two trips in three.
Where along the Danube does the wind matter most?
In Austria and on to Budapest. Below Belgrade, the advantage flips.
| Section, April to October | Downstream wind, km/h (mph) | Headwind hours, down / up | Modelled time, down / up |
|---|---|---|---|
| Germany (source to Passau) | 1.6 (1.0) tailwind | 27.3% / 39.7% | −1.2% / +4.0% |
| Austria (Passau to Vienna) | 2.6 (1.6) tailwind | 28.4% / 45.6% | −2.2% / +6.1% |
| Vienna to Budapest | 2.4 (1.5) tailwind | 26.8% / 43.7% | −2.0% / +5.7% |
| Budapest to Belgrade | 1.4 (0.8) tailwind | 28.3% / 39.9% | −0.7% / +3.6% |
| Belgrade to the Black Sea | 0.4 (0.3) headwind | 37.5% / 30.8% | +2.4% / +1.1% |
- Austria, the classic week, gives the biggest push; in the valley the wind mostly blows along the river.
- Vienna to Budapest is the most exposed, with the biggest side-on wind, 7.6 km/h (4.7 mph). Grid cells between Vienna and Bratislava averaged 12.8–13.6 km/h (8.0–8.5 mph).
- The lower Danube reverses the pattern. Between Belgrade and Golubac the most common wind was south-easterly; between Vidin and Nikopol in Bulgaria, easterly, in 25–31% of hours.
Our verdict: should you ride the Danube upstream or downstream?
Ride downstream. The wind favours it from Donaueschingen to Budapest, where most people ride, and the gradient agrees.
It's a tiebreaker, though: our model rider saves about two and a half hours of pedalling to Budapest. From Belgrade to the Black Sea, the wind gives you no reason to go east.
What else should decide your direction?
The guidebooks and getting home.
- Official stages run downstream. Deutsche Donau's 12 German stages end in Passau; Donau Niederösterreich's stage 1 is Passau to Schlögen; EuroVelo 6 runs from Nantes to Constanța.
- River kilometres are counted upstream from the mouth, Deutsche Donau notes, so the markers count down as you ride east.
- Trains home. Bike spaces are limited, so book early; our route guide covers ÖBB and Hungarian trains.
- Season. Upper Austria recommends May to October.
How should you plan around the wind for your dates?
Use the averages to pick a direction, then let the forecast take over.
- Pick the direction and month from the tables above.
- Treat Vienna to Budapest as the exposed stretch, and check how windy is too windy to cycle. Official warnings come first.
- Read each day's forecast against the path, a week out and the evening before: reading a forecast for a bike ride explains why a town forecast isn't enough.
Planning another classic? The same method answers the question for Land's End to John o' Groats. For more ideas, see the best cycling routes in Europe.
Frequently asked questions
How much time does riding downstream save on the Danube?
A few hours. Our model touring rider does 24.1 km/h (15.0 mph) in still air, so our 900 km (559-mile) line from Donaueschingen to Budapest takes about 37.3 hours. April-to-October wind made that 36.7 hours downstream and 39.2 upstream. The real path follows the river's bends, so it's longer.
Is the Danube Cycle Path windy?
Not very. In April-to-October riding hours, grid cells along our line averaged 8.4 to 14.0 km/h (5.2 to 8.7 mph), and 17.7% of hours were calm. The calmest cell was near Deggendorf in Bavaria; the windiest were at Constanța and between Vienna and Bratislava.
Can you ride the Danube Cycle Path upstream?
Yes, and the climb is tiny. The cost is mostly wind: between Passau and Vienna, upstream riders met headwinds in 45.6% of riding hours, and our model rider took 6.1% longer than in still air. Below Belgrade, upstream had slightly the better wind.
Why does the wind blow along the river in Austria?
Most likely because the valley steers it. Between Passau and Melk, every grid cell's most common riding-hour wind came from the west, 31% to 36% of hours, with east second, 15% to 21%. North and south winds were rare, so the wind tends to be straight behind you or in your face.
Where does this Danube wind data come from?
From ERA5, the European Centre for Medium-Range Weather Forecasts' reanalysis for the Copernicus Climate Change Service. We took hourly wind for 2015 to 2024 in every 0.25° grid cell along the river, about every 25 km (16 miles), and worked out how much blew along the path each way.
Get the wind for your ride.
Upload a GPX, add your start time and pace, and see the headwind, gusts, rain and heat for every stretch of the route, timed to when you’ll be there. Free for riders.
Make a free ride page →Sources and method
- Copernicus Climate Change Service (ECMWF) (2026). ERA5 hourly time-series data on single levels from 1940 to present
- Quarterly Journal of the Royal Meteorological Society (2020). The ERA5 global reanalysis (Hersbach et al.)
- Copernicus Climate Change Service (ECMWF) (2026). ERA5 hourly data on single levels from 1940 to present
- ECMWF (2026). ERA5: data documentation (native resolution 31 km)
- EuroVelo (European Cyclists' Federation) (2026). EuroVelo 6: Atlantic – Black Sea
- Oberösterreich Tourismus (2026). Danube cycle path on the north bank, Passau to Bratislava
- Donau Niederösterreich Tourismus (2026). Danube Cycle Path stages
- Deutsche Donau (2026). Donauradweg tour data
Windline's data desk downloaded hourly 10 m wind (the u and v components, turned into speed and direction) from the Copernicus Climate Data Store, dataset reanalysis-era5-single-levels-timeseries (ERA5 hourly time series on single levels, doi:10.24381/1cf1ad76; ECMWF's ERA5 reanalysis for the Copernicus Climate Change Service), for 1 January 2015 to 31 December 2024 (ten full years). ERA5 is described by Hersbach et al. (2020). The route is a line through 52 towns following the Danube Cycle Path and EuroVelo 6 from Donaueschingen to Constanța: Ulm, Ingolstadt, Regensburg, Passau, Linz, the Wachau, Vienna, Bratislava, Győr, Budapest, Mohács, Vukovar, Novi Sad, Belgrade, the Iron Gates, Vidin, Ruse and Silistra, using towns on either bank where EuroVelo 6 switches banks. It measures 2,053 km (1,276 miles) point to point, 900 km (559 miles) to Budapest; the real path follows the river's bends and is longer. It is not an official route. The line was cut into pieces of at most 25 km, and each piece takes its wind from the nearest ERA5 0.25° grid cell: every 0.25° grid cell along the route, about every 25 km, 93 cells in all, so results are weighted by distance. ECMWF gives the model's native resolution as about 31 km, so these are area averages, not roadside readings. Riding hours are the values stamped 08:00 to 17:00 local time inclusive (Central European time to the Iron Gates, Eastern European time from Orșova), with daylight saving applied. The riding season is April to October (months 4 to 10). For each hour and piece, the along-route wind is the wind speed times the cosine of the angle between where the wind comes from and the direction of travel; riding the other way flips the sign. A headwind hour has more than 4 km/h (2.5 mph) against you, a tailwind hour more than 4 km/h behind you; the rest are side-on or calm. Side-on wind is the average size of the crosswind part. Wind direction shares count where the wind comes from in eight sectors; hours under 5 km/h (3 mph) count as calm. Sections are split at Passau, Vienna, Budapest and Belgrade. Year-to-year figures are the downstream April-to-October average for each year, rounded to 0.1 km/h (2019 rounds to zero and counts as neither; standard deviation 1.01 km/h). The trip test rides the whole line in 30 equal days in each direction, starting on every date from April to October in 2015 to 2024 (2,140 start dates; trips must finish by 31 December 2024), with each piece taking that day's average riding-hours wind; the two directions are compared from the same start date. Modelled riding time uses a steady-power touring rider: 100 kg (220 lb) of rider, bike and luggage, 120 W, rolling resistance 0.006, drag area 0.45 m², air density 1.2 kg/m³, which gives 24.1 km/h (15.0 mph) in still air; wind at rider height is taken as 0.65 times the 10 m wind, and crosswind drag is ignored. The gradient comparison is our arithmetic with the same rider: Upper Austria's north-bank Passau-to-Bratislava route (381.4 km, 345 m of ascent and 496 m of descent) drops a net 151 m, an average grade of 0.04%; ridden as a steady 0.04% slope with no wind, that is 0.9% quicker downstream and 0.9% slower upstream than flat ground. We compare it with our Passau-to-Vienna wind, the nearest section we studied. The hours in the FAQ are our arithmetic: 900 km / 24.1 km/h = 37.3 hours, times 0.983 (36.7 hours) and 1.050 (39.2 hours). The Austrian valley figures cover the 9 grid cells from 48.5° N 13.5° E to 48.25° N 15.5° E; the Bulgarian figures the 10 cells from 44.0° N 22.75° E (Vidin) to 43.75° N 25.0° E (Nikopol); the Belgrade-to-Golubac figures the 4 cells from 44.75° N 20.75° E to 44.75° N 21.5° E. Every other figure is in results.json in the study's data folder. Imperial conversions use 1 mile = 1.609 km, 1 km/h = 0.621 mph and 1 m = 3.28 ft. Contains modified Copernicus Climate Change Service information (ERA5, 2015–2024); neither the European Commission nor ECMWF is responsible for any use of this information.
About the author
Wes Thomson, Founder, Windline. Wes Thomson builds Windline, live wind and weather forecasts timed to when riders reach each stretch of road. He built it for his own 2,093 km tour from Pont Drift to Cape Town, and writes these guides with the same focus: what the wind will do to your ride, and how to plan around it.