Windline turns your GPX routes into one live link. Every rider sees the headwind, gusts, rain and heat for the exact hour the group reaches each stretch of road, on a multi-day tour, a stage race or the Saturday club ride.
No app for ridersOpens straight from the group chat
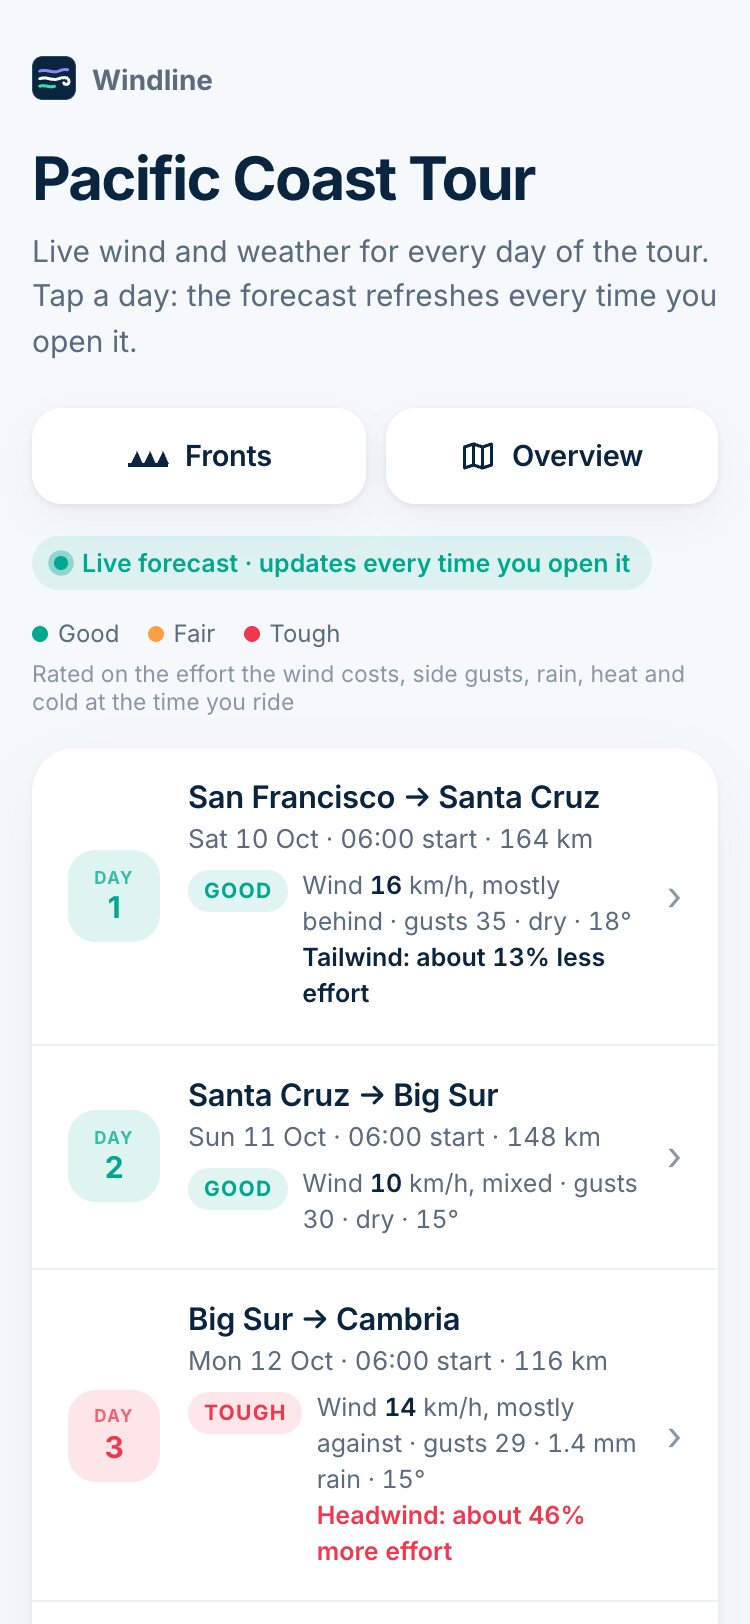
Tough11 km/hheadwind through Big Sur
Good13% less efforttailwind to Santa Cruz
The 9 pm question
Every tour chat asks it. Nobody has a good answer.
Weather apps forecast one place at one time. A tour covers 200 km a day, through different weather, at different hours. The wind at the start tells you nothing about the climb at 11.
Wind against the road, not the town. We compare the wind to the direction of every stretch, so you see headwind and tailwind, not just “25 km/h WNW”.
Timed to where the group will be. Pace, climbs and stops are built in, so each forecast matches the hour you get there.
One link for everyone. Riders, support crew and family all see the same forecast.
T
Tour group38 riders · support crew
What’s the wind doing tomorrow? 🌬️
App says 30 from the west. At the start or on the coast road?
Here’s tomorrow, timed to our pace 👇
Wed · 108 km · 06:00 startDay 3 · Over the pass to the coast
Headwind 20 km/hGusts 8110–12°
tour.windline.tech/your-tour/day-3
Ok, early start and stick together on the long drag 🙏
How it works
Set it up once. It stays live for the whole event.
Load the routes once. From then on, every time someone taps a day, they get the newest forecast, timed to their ride.
01
Drop in the routes
Upload the GPX file for each stage. Windline reads the distance, climbing and direction of every stretch of road.
stage-09.gpx179 km
stage-10.gpx108 km
stage-11.gpx194 km
02
Set the start and pace
Date, start time, riding speed and stops. We work out when the group reaches each part of the route, slower on the climbs.
06:00 Start
12:03 Finish
25 km/h · 105 min of stops
03
Share one link
Paste it into the group chat. Each day gets a live Good, Fair or Tough rating, and one tap opens the full map.
Your tour, race or ridetour.windline.tech/your-tour
Tours, races, club rides
One link for any kind of ride.
Pick what you are running. Windline sets the page up the way your riders use it.
Multi-day tours
Every day of the tour on one page, each rated Good, Fair or Tough, timed to the group's pace with climbs and stops built in.
Stage races and events
Set a planned speed for each stage. Every rider shifts it faster or slower to see the wind for their own time on the road.
Weekly club rides
One link that never changes. It always shows the next four rides on your route, and each rider sets their own pace.
Fronts, maps and sharing
Cold fronts due over your days, an overview map of the whole event, and a branded image of any day to post on Instagram or Facebook.
Live demo
Five days down the Pacific Coast, rated right now.
San Francisco to Solvang along California’s coast, 628 km, always starting two days from today. Each day below was just rated in your browser from the latest Apple Weather forecast, exactly as your riders would see it.
See demo event →The real event page your riders get: every day, its map and its forecast.
Forecasting each stage…GoodFairTough
Rated on the effort the wind costs, side gusts, rain, heat and cold at the hour the group is on the road.Make one for your ride →
For your own rides
The wind on every ride you upload to Strava.
Connect Strava once. After every ride, Windline adds what the wind did to it to the ride’s description: where it was against you, where it pushed you home, the gusts and the temperature, at the times you actually rode. Your followers see it too.
Coffee stop in Franschhoek ☕

🌬️ Headwind ride: the wind made it about 18% harder. Toughest from km 40 to 55, 19 km/h head-on.
Wind 14 km/h from the south-east, gusts to 36 · 14–19°C · dry
Ride weather by Windline · windline.tech/strava · Apple Weather data
Inside a stage
Every kilometre, in plain words.
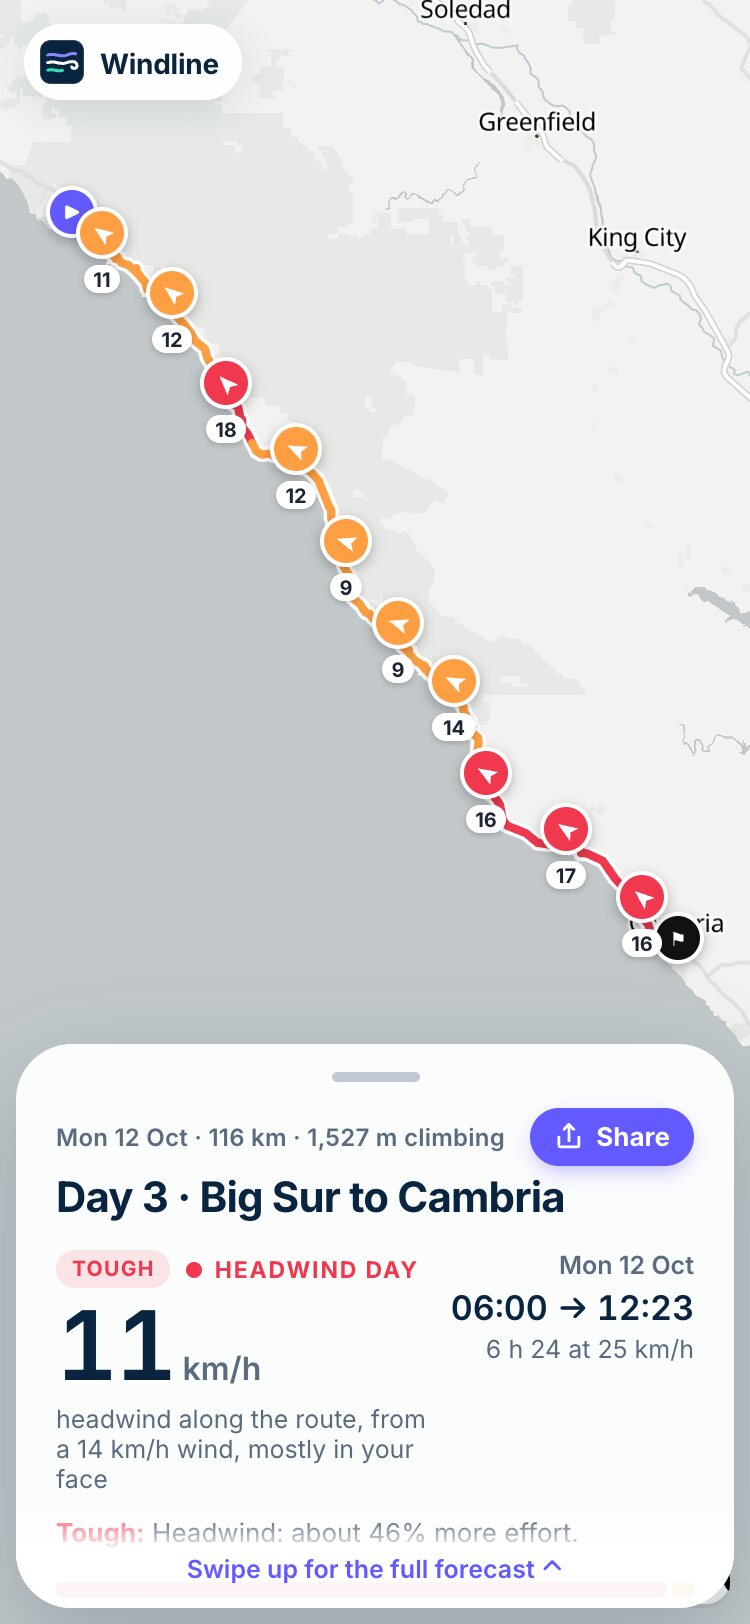
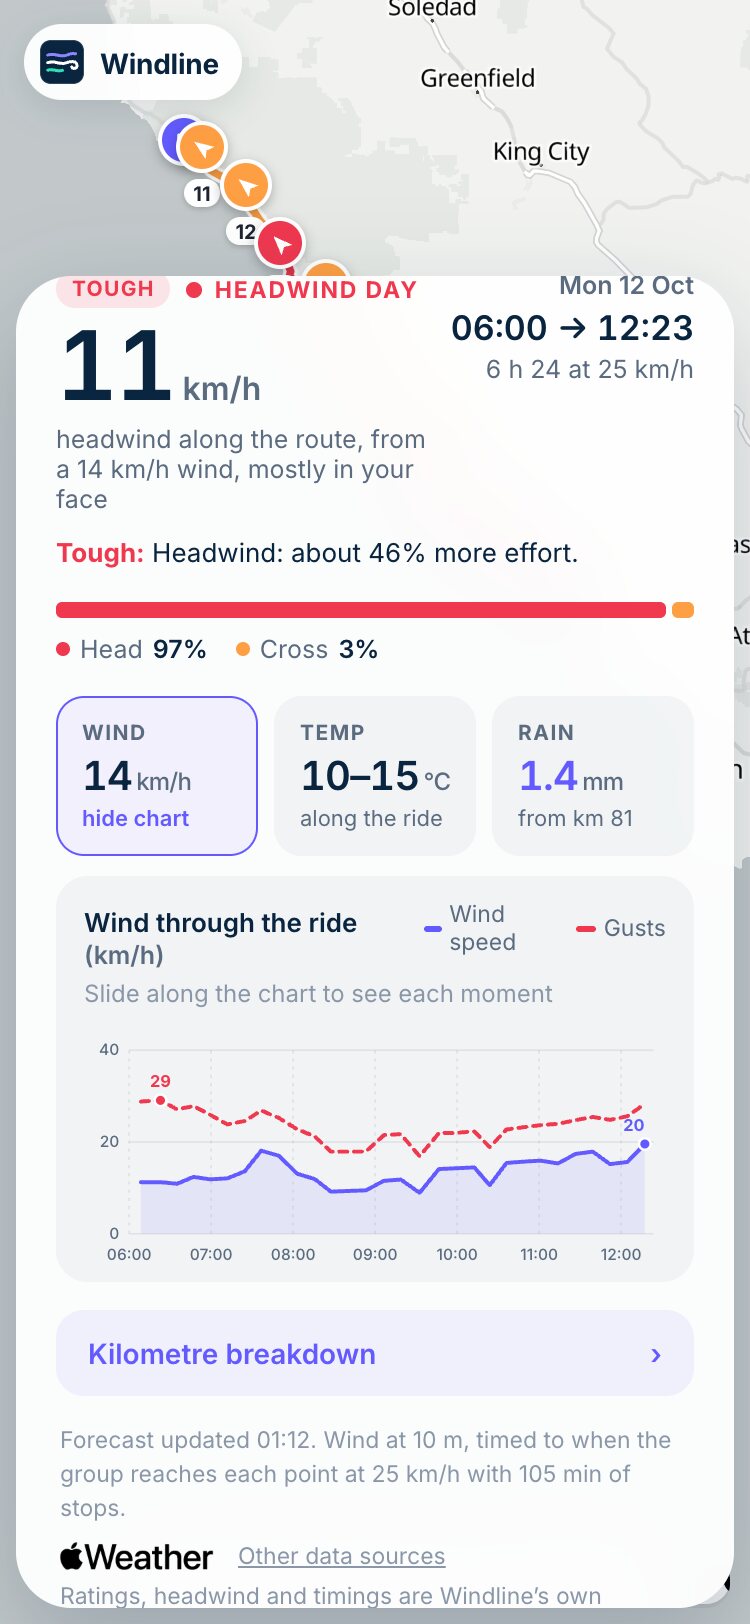
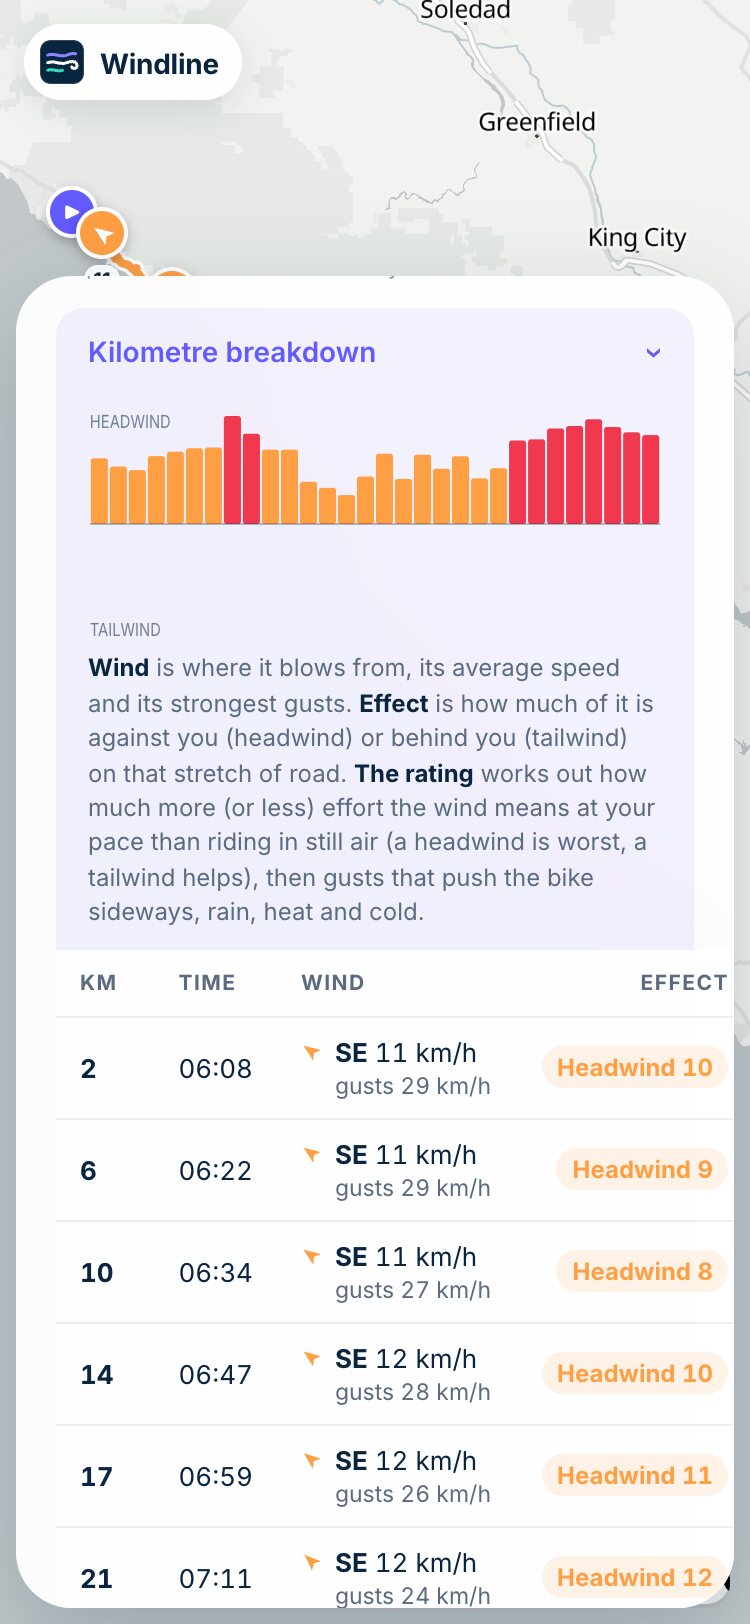
Tap a day and the whole stage opens on the map. These are real screens from the 116 km Big Sur stage, into a headwind.
THE MAP
See where it bites
Each arrow is the wind where the group will be at that hour. Red is in your face, amber is from the side, green is at your back.
HOUR BY HOUR
Watch it build
Tap wind, temperature or rain for a chart through the day. See when the wind builds and the gusts peak, and plan the regroup before then.
KILOMETRE BREAKDOWN
No jargon
“Headwind 10, gusts 28, at 06:47.” Every few kilometres, the wind and what it means for the bunch.
Accuracy
Apple Weather’s forecast. Rated by real cycling physics.
Apple Weather inside
The forecast behind Apple’s Weather app, read hour by hour at every stretch of your route, anywhere in the world.
Timed to the minute
Wind is blended between hourly readings to the moment the group reaches each stretch, not rounded to the hour.
Rated by physics
Each day’s rating works out the effort the wind costs or saves at your pace, then side gusts, rain, heat and cold. A tailwind never counts against you.
Tailwind: about 37% less effort
Never stale
Forecasts refresh through the day, up to 10 days ahead, and every rider sees the same forecast on every page.
For organisers
Made for the people who carry the tour.
You plan the start times, the regroups and the support vehicles. Windline gives you the wind for every one of those decisions, and gives your riders one place to look.